New Features in Graphpad Prism 9
- Principal Component Analysis (PCA), a method used to project data in higher dimensional space into a lower dimensional space by maximizing the variance of each new dimension. PCA is mostly used as a tool in exploratory data analysis and for making predictive models. It is often used to visualize genetic distance and relatedness between populations.
- New graph types generated by PCA
- Scree plots. Scree plots are used to visualize raw eigenvalues for each principal component (PC) identified in principal component analysis (PCA).
- Score plots. Score plots provide a means of viewing the original data in the new (reduced) dimensional space of two indicated PCs (typically PC1 as the horizontal axis and PC2 as the vertical axis).
- Loading plots. Loading plots provide a means to visualize the coefficients for two selected principal components.
- Biplots. Biplots are combinations of score plots and loading plots.
- Proportion of variance plots. This graph is similar to the Scree Plot described above, but is used with a slightly different interpretation style.
- Multiple variables graphs to graph data from the Multiple variables data table
- Make a Bubble Plot, where symbol size is encoded by a numerical or categorical variable.
- Encode symbol color and the appearance of connecting lines with other variables.
- All these choices are made on a brand new Format Graph dialog with an improved appearance.
- New semi-transparent color schemes for bubble plots.
- Estimation Plots which are a visual way to present the results of two-sample comparison tests such as the t test. The purpose of this graph which contains raw data as well as a summary of the analysis result is to emphasize the importance of effect sizes and confidence intervals while simultaneously de-emphasizing the concept of “significance”.
- Pairwise comparisons on graphs which is an automatic generation of visualizations that combine user data with results of pairwise comparisons made during hypothesis tests (i.e. automatically adding significance stars to graphs).
Principal Component Analysis (PCA) with Example
Sometimes, the amount of variables collected far outweighs the number of subjects that were available to study. Consider gene expression studies in which expression levels of hundreds or thousands of different genes were measured from subjects divided into two groups: a treatment group and a control group. There may simply be too many variables to fit a model to the data. But selecting some variables to exclude from the analysis is simply throwing information away that could be useful! PCA (Principal Component Analysis) is a technique of “dimensionality reduction” that can be used to reduce the number of required variables while eliminating as little information from the data as possible.
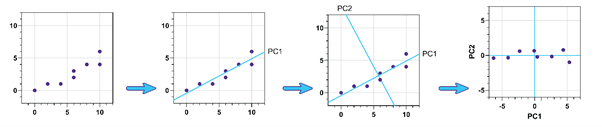
Note: the above figure show Principal Component Analysis on two dimensions as a visual example. PCA in Prism can be performed on HUNDREDS of variables!
Additional features available within principal component analysis (PCA) include:
• Component selection via Parallel Analysis (as well as the Kaiser method, threshold of total variance
method, and others)
• Generation of Scree Plots, Score Plots, and Biplots
• Automatic preparation of principal component analysis results for further use in multiple linear regression (Principal Component
Regression)
Feature Improvements
- Nonlinear regression
- Dramatically improved performance and accuracy of evaluating user-defined equations
- Define X0 for differential equations like any other parameter
- Create five residual graphs (including the new Actual vs Predicted graph). Previously, only one graph per analysis could be generated
- Re-arranged and re-labeled the options for “Unstable parameter and ambiguous fits” section on the Confidence tab of the NLR parameters dialog
- Multiple linear/logistic regression analyses
- Choose models with categorical independent variables with automatic reference level specification
- Specify method for “automatic” reference level specification based on data (first or last level, most or least frequent level)
- Specify the order of categorical variable level results via the “Define categories order” options from the Reference level tab of the MLR parameters dialog
- Improved model control (tree view) for better presentation of categorical variables and interactions
- Simplified model representation in the dialog
- Interpolate values for the outcome (dependent) variable using data in the data table or specified values for each predictor in the parameters dialog (multiple linear regression only)
- Improved Correlation matrix output so a heatmap of the results can be generated
- Multiple two sample tests analysis (Multiple t test analysis) now includes options for:
- Multiple unpaired t-tests with Welch correction
- Multiple paired t-tests
- Multiple ratio-paired t-tests
- Multiple nonparametric unpaired Mann-Whitney tests
- Multiple nonparametric paired Wilcoxon tests
- Multiple nonparametric unpaired Kolmogorov-Smirnov tests
- Row statistics analysis
- Allows for calculation of mean with custom confidence interval level
- Allows for calculation of medians with “no errors”, “quartiles”, “min / max”, “percentiles”
- Allows for calculation of geometric means with “no errors”, “geometric SD”, “CI”
- Two-way ANOVA: main effects only model
- Allow for main effects only model (no interaction term) in two-way ANOVA for data with replicates
- Allow missing factors levels combination in two-way ANOVA for main effects only model
- “Simple effects” multiple comparisons not allowed for unreplicated two-way ANOVA
- Made the default title of standard transform with linked parameter be generated using analysis constant name instead of a value.
- Changed the default to the choice for unstable in ‘Confidence’ tab of ‘Parameters: Nonlinear Regression’ dialog.
- Updated the behavior of analyses that can be performed on multivariable tables to properly handle different variable types
- When creating a correlation matrix, choose to ignore rows where any value is missing or excluded. With this option selected, all correlation coefficients in the matrix computed from the same set of rows
- Allowed ‘Select and Transform’ analysis to define types for variables in green multiple variables results table
- (Mac) Added the alert “You are trying to analyze a single column. If you wish to perform a one-sample t test, use the One sample t and Wilcoxon test analysis. A t test requires two groups (both in Y columns; the X column is ignored)”
Non-math feature improvements
- New data limits
- Lifted data table limits of 1024 data sets [letters A…AMJ] and 512 sub-columns.
- Lifted graph limits to be able to plot 1024 data sets.
- Multiple variable data tables
- Enabled the support of text variables in GraphPad Prism multiple variables data tables.
- Implemented the ability to define variable types in GraphPad Prism multiple variables data tables
- Special symbols and Unicode
- Added the “Character>Unicode Symbols…” command in the Insert main menu, which will open the standard system “Character Map” dialog and allow entering a bigger variety of special symbols.
- (Windows) Upgraded- GraphPad Prism 9 “Insert Character Dialog” and replace the legacy approach of using Symbols font for Greeks/Maths/European characters with Unicode compatible characters, thus, allow seamless compatibility across platforms and 3rd party apps.
- Added the Export command to the contextual menu opened in the Navigator when right-clicking on any sheet type, including graphs and layouts.
- Made Prism also delete graphs if you delete parent analysis which generated those graphs, but doesn’t delete graphs when an analysis adds a curve to an existing graph of data.
- Changed the command “Choose Color Scheme…” in the main Change menu to “Color Scheme>” and made it open the submenu showing the same content except for Background, Plotting area, Axes for ‘Bubble Plot’ graphs.
- Added the new section with semi-transparent color schemes to ‘Change -> Color Scheme’ and ‘Change colors’ toolbar’s dropdown menus.
- Implemented collection of user’s name and email while performing silent activations in order to provide improved product support and education
- Updated URLs in floating notes of sample data files from the Welcome dialog to point to the GraphPad Prism 9 User guide (instead of an earlier version of the guides)
- Formatting of graphs or data points on graphs from a data table and results
- (Windows) Made it possible to apply Bar, Error Bar and Line options using the Format Points contextual menu from a data table to the scatter with bars grouped graphs.
- (Windows) Made it possible to apply Error Bar and Line options using the Format Points contextual menu from a data table to scatter grouped graphs.
- (Windows) Made it possible to apply Line and Quartile formatting using the Format Points contextual menu from a data table to Violin graphs.
- (Windows) Made it possible to apply Error Bar and Line options using the Format Points contextual menu from a data sheet for superimposed Scatter graphs.
- (Windows) Made it possible to format data points on a graph from the green results tables. Case 1056514.
- (Windows) Enabled the formatting of selected symbols on a violin graph from the Format Points contextual menus on a data table.
- (Windows) Enabled the formatting contextual menu for a violin in the “Violin plot only” graph with reverse direction
- (Mac) Enabled the Line section in the Format Points contextual menus to be able to format data points on graphs with means and medians from the data table
- (Windows) GraphPad Prism 9 can now import “True” or “False” boolean values from excel as “1” and “0” into Prism’s multiple variables data tables
- (Windows) Made GraphPad Prism 9 show all sheets from the family in the ‘Delete Sheet(s)’ dialog opened in the family navigator panel
- (Windows) Updated system requirements to Windows 7. Added the alert about urging to update Windows when Prism starts on Vista
- (Mac) Removed the “Y” label on top of each individual column in Column/Grouped/Contingency/Multiple Variable/Parts of Whole data tables
- (Mac) Made GraphPad Prism 9 remember the size of the last used window, and use that as the default size for new windows
- (Mac) Enabled the ‘Reverse Category Order’ command in the ‘Change’ and context menus for Parts of Whole graphs
- (Mac) Renamed the ‘Reverse Data Set Order’ command to ‘Reverse Category Order’ in the ‘Change’ and context menus for Parts of Whole graphs
Performance Improvements
- Improved the performance of the ‘Correlation matrix’ analysis more than 20x
- (Windows) Improved the performance of the Fit spline/LOWESS analysis with residual calculations by ~10x
- (Windows) Improved the performance of the ‘Simple logistic regression’ analysis more than 1.5x
- (Windows) Improved the performance of the ‘Transform’ analysis by ~4x
- (Windows) Improved the performance of the ‘Prune rows’ analysis by ~3x
- (Windows) Improved the performance of simulating XY data with a large number of values and several replicates more than 10x
- (Windows) Improved the performance of switching to a Grouped graph sheet when the source data contains a large number of rows more than 3x
- (Windows) Improved the performance of the ‘Normalize’ analysis slightly
- (Windows) Improved the performance of the ‘Monte-Carlo’ analysis when the source data table contains data linked from other analyses by several times
- (Mac) Improved the performance of the ‘Transform’ analysis by ~2.5x
- (Mac) Improved the performance of the ‘Prune rows’ analysis more than 10x
- (Mac) Improved the performance of switching to a Grouped graph sheet when the source data contains a large number of rows more than 2x
- (Mac) Improved the performance of the ‘Normalize’ analysis more than 5x
Infrastructure
- (Windows) Prism 9 is only available for 64-bit Windows. There is no 32-bit version of Prism for Windows.
- (Mac) Prism 9 requires macOS 10.12 (Sierra) or newer.
GraphPad Prism is a leader in Scientific Graphing Software. Download a 30 days GraphPad Prism free trial .
For more information regarding Principal component analysis you can refer to the GraphPad Prism Resource Page.


