Enhance your scientific analytical skills with GraphPad Prism & Biostatistics Training courses.
Graphstats Academy is our training platform where we provide training on data visualization and the fundamentals of Biostatistics. Our GraphPad Prism & Biostatistics training modules are carefully designed considering the diverse needs of both beginner and advanced skill levels.
GraphPad Prism & Biostatistics Training Program Uniqueness
Tailored for excellence.
Live Interactive Sessions
Our Prism Training courses are live one-on-one sessions which allow participants to engage in real time discussion with hands-on-experience and interaction with the trainer.
Personalized Attention
Our prism software courses are designed to offer personalized attention to the participants as the trainer can address their queries individually and provides guidance based on the participant's skill level.
Customizable Courses
Our GraphPad Prism courses are customizable: the training can be tailored by adjusting the needs and objectives of the participants by allowing them to personalize contents of their chosen Training Module.
Certificate of Accomplishment
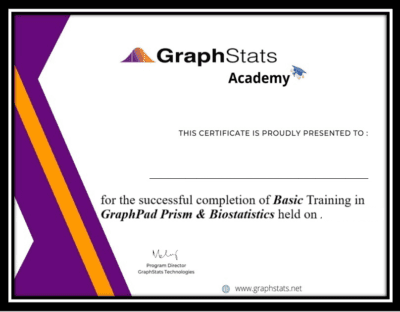
Upon completion of the GraphPad training, participants will receive a Certificate of Accomplishment as a validation and recognition of their individual efforts, contributing to their personal and professional development.
Real-world Relevance
Our Prism courses are carefully crafted using an application-oriented approach where the trainer uses practical examples relevant to the participant's field, allowing them to understand how to draw meaningful insights from their findings.
Basic Training Module – An Introduction to Biostatistics
Topics Covered under GraphPad Basic Module
Learning Objectives
Upon completion of Basic course, participants should be able to:
- Use descriptive statistics to summarize and interpret your scientific data.
- Conduct Normality test and identify outliers in the dataset.
- Construct confidence intervals.
- Learn the principles of statistical hypothesis testing.
- Choose appropriate post hoc tests and conduct ANOVA.
- Perform t-test on paired and unpaired samples.
- Calculate p-value in hypothesis testing.
- Observe correlation & Regression.
Graphpad Basic
Live one-on-one session · 2 hours
The Basic module of our Biostatistics & GraphPad Prism Training introduces you to the fundamentals of Biostatistics. This two-hour Instructor led online session will take you through the fundamentals of Biostatistics, how to choose the proper tests and which statistical methods to use to get the correct insights from your data.
Get A QuoteGet Certificate of Completion
Upon Successfully Finishing the Course, participants receive a Certificate of Accomplishment, a formal recognition of their learning and dedication, delivered to their registered email address.
- Sent to your registered email
- Valid credential for your professional profile
- Recognized by industry and academic institutions

Up Next
Professional Training Module – Getting Things Done with GraphPad Prism
Professional Training Module – Getting Things Done with GraphPad Prism
Graphpad Professional
Live one-on-one session · 2 hours
The professional module introduces you to GraphPad Prism. Learn how to get things done using GraphPad Prism. This two-hour instructor led online session will introduce you to data tables, performing various statistical tests, choosing the correct statistical test as well as data visualization and graphing techniques for making successful graphs.
Get A QuoteTopics Covered under GraphPad Professional Module
Learning Objectives
Upon completion of Professional course, participants should be able to:
- Easily navigate through GraphPad Prism workspace and customize preferences and settings.
- Work with different forms of data tables including creating and importing data tables and manipulating data tables for various statistical analysis.
- Understand capabilities of GraphPad Prism with different data sets and data analysis techniques.
- Create graphs (Bar, scatter, box and whisker, etc.) for data visualization and customize graphs for better interpretation & presentation of data.
- Perform appropriate statistical analyses on your observation.
Get Certificate of Completion
Upon Successfully Finishing the Course, participants receive a Certificate of Accomplishment, a formal recognition of their learning and dedication, delivered to their registered email address.
- Sent to your registered email
- Valid credential for your professional profile
- Recognized by industry and academic institutions

Up Next
Advance Training Module – Prism for Enzyme Kinetics and Pharmacology
Advance Training Module – Prism for Enzyme Kinetics and Pharmacology
Topics Covered
Enzyme Kinetics
- Michaelis-Menten
- Competitive inhibition
Pharmacology
- Dose-response
- Binding Saturation
- Schild competitive antagonist
- Global nonlinear regression
- Operational model of agonist action
Learning Objectives
Upon completion of Advance module, participants should be able to:
- Understand Michaelis-Menten & competitive inhibitions in enzyme kinetics.
- Perform Dose-response, Binding saturation in pharmacology.
- Use global nonlinear regression.
- Apply Schild analysis and operational models for pharmacological data.
Graphpad Advanced
Live one-on-one session · 2 hours
The Advanced GraphPad Prism Training module is custom designed for scientists and researchers related to the pharma industry. This two-hour instructor led session will help you reduce the learning curve and master your skills of using GraphPad Prism for Enzyme Kinetics and Pharmacology.
Get A QuoteGet Certificate of Completion
Upon Successfully Finishing the Course, participants receive a Certificate of Accomplishment, a formal recognition of their learning and dedication, delivered to their registered email address.
- Sent to your registered email
- Valid credential for your professional profile
- Recognized by industry and academic institutions
Faculty Profile

- 🏛️Renowned mathematical biologist working at present as a full professor.
- 🎓Alumnus of IIT Bombay, PhD from MEXT, Japan, and underwent research training in 26 countries.
- 📊Teaching biostatistics for the last 14 years, with expertise on intricacies of GraphPad Prism.
- 📄Published over 120 Peer Reviewed Research Papers, guided 17 PhDs, and won 16 grants.
- 🎥Running a popular MOOC on biostatistics with over 15,000 enrollees till date.
- 📚Recently published a well-received Textbook on Biostatistics.
Register for a Free Webinar
Join our complimentary live webinar and get a firsthand look at how GraphPad Prism & Biostatistics training can transform your research. Limited seats, so register today.
Frequently Asked Questions
How long does it take to complete the GraphPad Prism training course?
GraphPad Prism & Biostatistics Training program is organized in three different Modules (Basic Training Module - An introduction to Biostatistics, Professional Training Module - Getting Things Done with GraphPad Prism & Advance Training Module - Prism for Enzyme kinetics and Pharmacology) these Prism course span a duration of 2-hours.
Who can enroll in this GraphPad Prism course?
GraphPad Prism & Biostatistics Training modules are designed for individuals involved in scientific research, particularly those in the fields of Pharmaceutical, Biotech, biology, healthcare, and related discipline or anyone interested in biostatistics, regardless of their professional background, who want to gain a deeper understanding of statistical analysis can enroll in our Academy courses.
Which Graphpad Prism & Biostatistics Training Module is best suited for me?
Prism courses cater scientific researcher, students, health care, medical, pharma & biotech related field disciple equally. Whether you are seasoned Professional in biostatistics who wants to get the deeper understanding of Graphpad Prism software or a Beginner looking to build your core skill in Biostatistics and Biostatistical analysis, Prism Training courses got you covered.
If you are looking to solidify your foundation in Biostatistics and get the theoretical comprehensive understanding of how to carry out various biostatical analysis like Normality, Outliers, Confidence Intervals, Statistical Hypothesis testing, P Value, t-Tests – Paired/Unpaired, Tests for contingency tables, ANOVA, Post Hoc tests, Correlation and Regression and so on then we recommend you to enrol in Basic training module - An introduction to Biostatistics.
However, if you possess standard knowledge on Biostatistical analysis and wishes to get familiarized with GraphPad Prism's software interface, understand the intricacies of the prism software and learn data visualization or how to carry out various biostatistical tests in GraphPad Prism then we suggest you to enroll in our Professional training module - Getting things done with GraphPad Prism.
Can I customize the contents of GraphPad Prism & Biostatistical Modules?
Yes, you can customize the course contents for GraphPad Prism & Biostatistics Training Modules. The Basic Training Module - An introduction to Biostatistics will focus predominantly on theoretical concepts in Biostatistics principles and Biostatistical analysis and for our Professional Training Module - Getting things done with GraphPad Prism, you have the flexibility to send us the specific topics that you would like to incorporate into the professional training Module, we will then evaluate your requested topics and check if we can accommodate them into the training module.
Will I get a certificate after completing GraphPad Prism & Biostatistics Training program?
Yes, the certificate of accomplishment will be provided after the successful completion of chosen GraphPad Prism & Biostatistics Training module on the registered email address.
Still have questions? We're happy to help.
Contact Us