Analyze, Graph and Present your scientific Work
Introducing GraphPad Prism 11, a versatile Statistical Graphing Software used by Scientists, Not Statisticians.

Comprehensive Analysis and Powerful Statistics, Simplified
Organize Your Data Effectively
GraphPad Prism is primarily formatted for the analyses you want to perform, including the study of quantitative and categorical data. This makes it easy to enter data accurately, select acceptable analyses, and create amazing graphs.
Start a Free Trial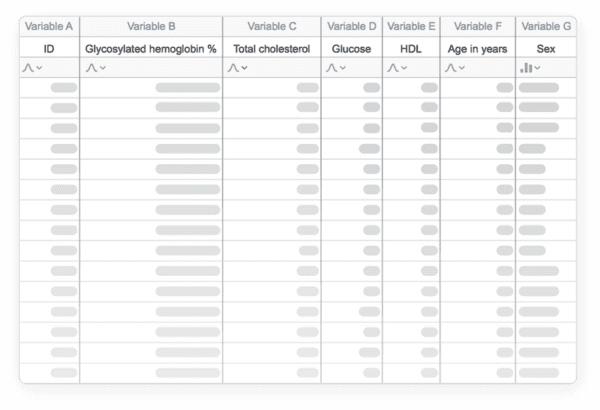
Perform The Right Analysis
Skip the statistical jargon.
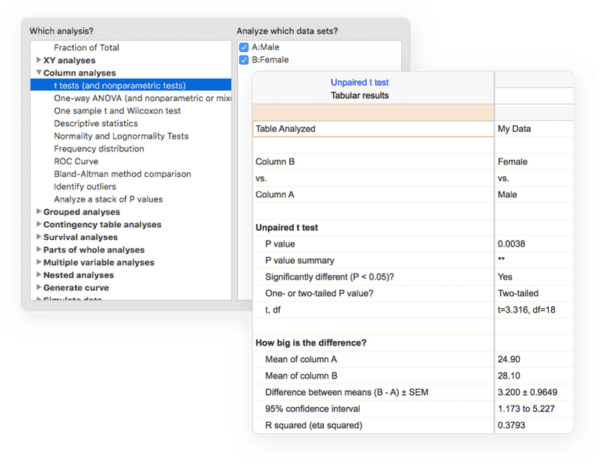
GraphPad Prism offers a broad variety of analyses from standard to very specialized: t tests, one-, two- and three-way ANOVA, linear and nonlinear regression, dose-response curves, binary logistic regression, survival analysis, principal component analysis, and many more.
Every study has a checklist to help you understand the necessary statistical assumptions and ensure that you have chosen an acceptable test.
Start a Free TrialGet Actionable Help As You Go
Simplify the complexity of statistics.
The online help of GraphPad Prism software goes beyond your expectations. Almost any step of the way, you can browse thousands of pages from Prism Guides online.
Browse the Graph Portfolio to learn how to create a wide variety of graph types. Sample data sets help you understand why you should carry certain analyses and how the conclusions can be viewed.
Start a Free Trial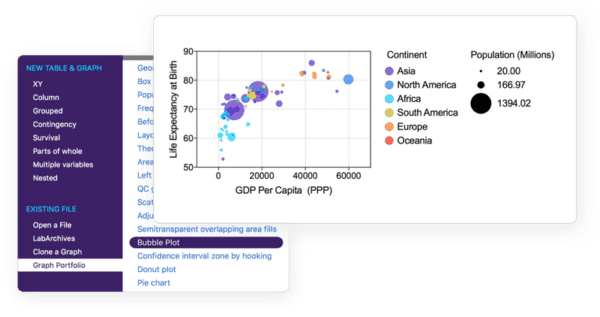
Work Smarter, Not Harder
GraphPad Prism removes the complexity so you can focus on what matters: your research.
One-Click Regression Analysis
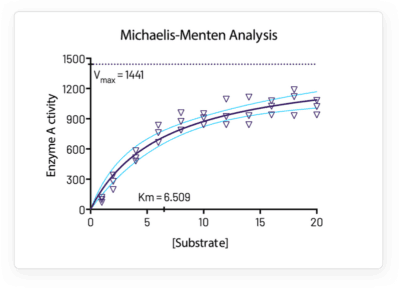
No other software simplifies curve fitting like the way Graphpad Prism 11 does. Just select the equation and Prism does the rest-fits the curve, shows the table of results and function parameters, plots the curve on the graph, and interpolates unknown values.
Start a Free Trial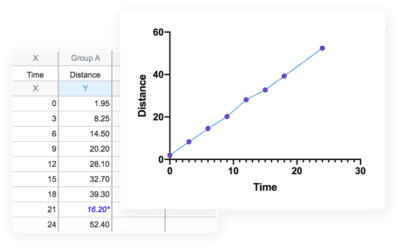
Focus on Your Research, Not Your Software
Graphpad Prism 11 does the coding for you. Graphs and results are auto updated in real time. Any modifications in data and analyses-direct data entry, omitting inaccurate data, correcting typos, or modifying analysis methods-are mirrored immediately in graphs, results and layouts.
Start a Free Trial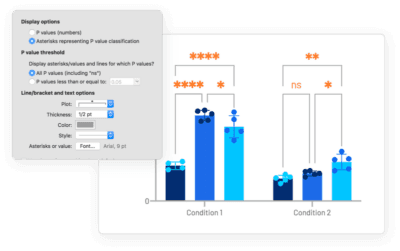
Automate Your Work Without Programming
Just one click and automatically apply several pairwise comparisons to the analysis. To configure these lines and asterisks, simply press the Toolbar button again. Make changes to the data or analysis, and the results shown on the graph will be changed automatically.
Start a Free TrialThe Fastest Way to Elegantly Graph and Share Your Work
Countless Ways to Customize Your Graphs
GraphPad Prism is a leader in Scientific Graphing Software. Concentrate on your data story, not configuring your software. GraphPad Prism software makes it simple to build the graphs you like. Choose the graph type, you can literally customize any component on the graph-how the data is structured, the layout of the data points, fonts, colors, labels and more. The possibilities for customization are infinite.
Start a Free Trial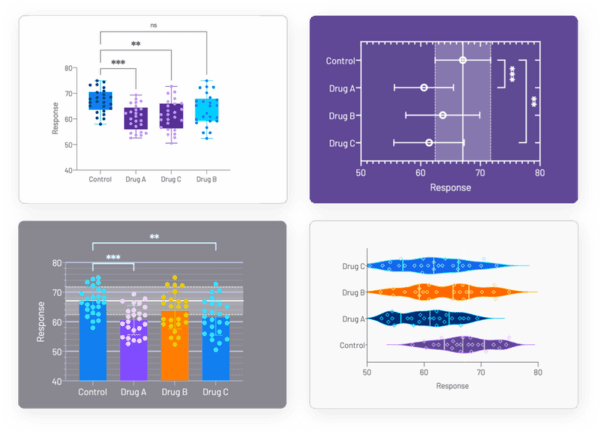
Explore Data with GraphPad Prism 11
Prism 11 allows you to easily explore large data sets and customize how you view the relationships in your data. You can concentrate your efforts on the most relevant data.
Start a Free TrialExport Publication-Quality Graphs With One Click
Graphpad Prism helps you reduce the time to publish. You can configure your exports (file type, dimensions, resolution, transparency, RGB/CMYK color space) to suit the journal specifications. To save time you can set your defaults.
Start a Free Trial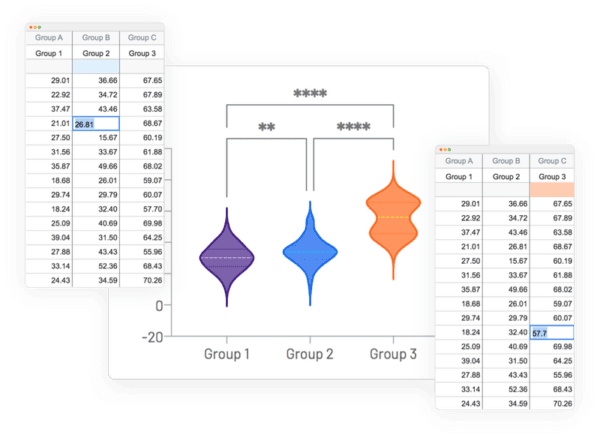
Enhance Collaboration
Share more than just the graphs. Graph pad Prism's detailed record of your data makes it possible to have a meaningful cooperation with other scientists. All details of your Prism project (analyses, graphs, raw data, results and layouts) are stored in a single file that you can share with a single click. Now, everyone can conveniently track your work at any stage, increase the clarity of your conclusions and streamline your collective efforts.
Start a Free TrialAccelerate Smarter Data Analysis with GraphPad Prism's Powerful Features
Introducing an even more powerful Prism featuring enhanced data visualization and graph customization, more intuitive navigation, and more sophisticated statistical analyses.
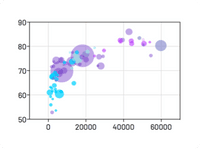
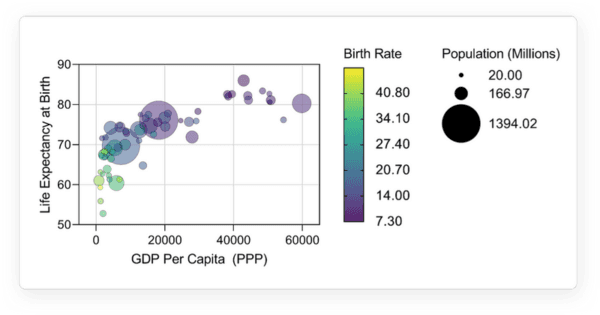
Bubble Plots
Create Bubble Plots directly from raw data, encoding variables for position (X- and Y-coordinates), color, and size
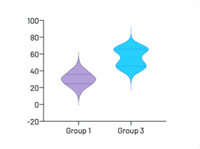
Violin plots
Visualize distributions of large data sets with either extended or truncated violin plots
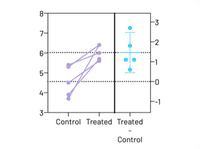
Estimation Plots
Automatically display your analysis results
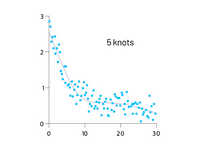
Smoothing spline
Major improvements in showing general data trends through Akima splines and smoothing splines with improved control over the number of knots, or inflection points
What Can GraphPad Prism Do?
Statistical Comparisons
- Paired or unpaired t tests. Reports P values and confidence intervals.
- Automatically generate volcano plot (difference vs. P value) from multiple t test analysis.
- Nonparametric Mann-Whitney test, including confidence interval of difference of medians.
- Kolmogorov-Smirnov test to compare two groups.
- Wilcoxon test with confidence interval of median.
- Perform many t tests at once, using False Discovery Rate (or Bonferroni multiple comparisons) to choose which comparisons are discoveries to study further.
- Ordinary or repeated measures ANOVA followed by the Tukey, Newman-Keuls, Dunnett, Bonferroni or Holm-Sidak multiple comparison tests, the post-test for trend, or Fisher's Least Significant tests.
- One-way ANOVA without assuming populations with equal standard deviations using Brown-Forsythe and Welch ANOVA, followed by appropriate comparisons tests (Games-Howell, Tamhane T2, Dunnett T3).
- Many multiple comparisons test are accompanied by confidence intervals and multiplicity adjusted P values.
- Greenhouse-Geisser correction so repeated measures one-, two-, and three-way ANOVA do not have to assume sphericity. When this is chosen, multiple comparison tests also do not assume sphericity.
- Kruskal-Wallis or Friedman nonparametric one-way ANOVA with Dunn's post test.
- Fisher's exact test or the chi-square test. Calculate the relative risk and odds ratio with confidence intervals.
- Two-way ANOVA, even with missing values with some post tests.
- Three-way ANOVA (limited to two levels in two of the factors, and any number of levels in the third).
- Analysis of repeated measures data (one-, two-, and three-way) using a mixed effects model (similar to repeated measures ANOVA, but capable of handling missing data).
- Kaplan-Meier survival analysis. Compare curves with the log-rank test (including test for trend).
- Comparison of data from nested data tables using nested t test or nested one-way ANOVA (using mixed effects model).
Nonlinear Regression
- Fit one of our 105 built-in equations, or enter your own. Now including family of growth equations: exponential growth, exponential plateau, Gompertz, logistic, and beta (growth and then decay).
- Enter differential or implicit equations.
- Enter different equations for different data sets.
- Global nonlinear regression - share parameters between data sets.
- Robust nonlinear regression.
- Automatic outlier identification or elimination.
- Compare models using extra sum-of-squares F test or AICc.
- Apply constraints.
- Differentially weight points by several methods and assess how well your weighting method worked.
- Accept automatic initial estimated values or enter your own.
- Automatically graph curve over specified range of X values.
- Quantify precision of fits with SE or CI of parameters. Confidence intervals can be symmetrical (as is traditional) or asymmetrical (which is more accurate).
- Quantify symmetry of imprecision with Hougaard's skewness.
- Plot confidence or prediction bands.
- Test normality of residuals.
- Runs or replicates test of adequacy of model.
- Report the covariance matrix or set of dependencies.
- Easily interpolate points from the best fit curve.
- Fit straight lines to two data sets and determine the intersection point and both slopes.
Column Statistics
- Calculate descriptive statistics: min, max, quartiles, mean, SD, SEM, CI, CV, skewness, kurtosis.
- Mean or geometric mean with confidence intervals.
- Frequency distributions (bin to histogram), including cumulative histograms.
- Normality testing by four methods (new: Anderson-Darling).
- Lognormality test and likelihood of sampling from normal (Gaussian) vs. lognormal distribution.
- Create QQ Plot as part of normality testing.
- One sample t test or Wilcoxon test to compare the column mean (or median) with a theoretical value.
- Identify outliers using Grubbs or ROUT method.
- Analyze a stack of P values, using Bonferroni multiple comparisons or the FDR approach to identify significant findings or discoveries.
Generalized Linear Models (GLMs)
- Generate models relating multiple independent variables to a single dependent variable using the new multiple variables data table.
- Multiple linear regression (when Y is continuous).
- Poisson regression (when Y is counts; 0, 1, 2, ...).
- Logistic regression (when Y is binary; yes/no, pass/fail, etc.).
Clinical (Diagnostic) Lab Statistics
- Bland-Altman plots.
- Receiver operator characteristic (ROC) curves.
- Deming regression (type ll linear regression).
Simulations
- Simulate XY, Column or Contingency tables.
- Repeat analyses of simulated data as a Monte-Carlo analysis.
- Plot functions from equations you select or enter and parameter values you choose.
Other Calculations
- Area under the curve, with confidence interval.
- Transform data.
- Normalize.
- Identify outliers.
- Normality tests.
- Transpose tables.
- Subtract baseline (and combine columns).
- Compute each value as a fraction of its row, column or grand total.
Multiple Variable Graphing
- Specify variables defining axis coordinates, color, and size.
- Create Bubble Plots.
Frequently Asked Questions
What is GraphPad Prism used for?
GraphPad Prism is used for biostatistical analysis, scientific graphing, nonlinear regression, curve fitting, data visualization, and research data interpretation. It is widely used for experimental, biological, pharmaceutical, clinical, and life-science research.
Is GraphPad Prism suitable for beginners?
Yes, Prism is designed with researchers and scientists in mind, including users who may not have advanced statistical or programming backgrounds.
Do I need to be a statistician to use Graphpad Prism?
You don't need to be a statistician to use Graphpad Prism 11 software. It is tailored for researchers rather than professional statisticians. Its guided workflows and intuitive interface help users perform common statistical analyses without needing extensive programming or statistical software experience.
Does Prism 11 require programming knowledge?
No, GraphPad is built to allow researchers to perform statistical analyses and create graphs without writing code. Its graphical interface and guided workflows make it accessible to users who do not have programming experience.
What statistical tests can be performed in GraphPad Prism?
GraphPad Prism supports a wide range of statistical analyses, including t-tests, ANOVA, nonparametric tests, correlation, linear and nonlinear regression, survival analysis, contingency table analysis, and many other statistical procedures.
How do I choose the right statistical test in GraphPad Prism?
The appropriate statistical test depends on various factors such as the type of data, number of groups, whether observations are paired or independent, data distribution, and the research question. It provides guided analysis workflows that help researchers select appropriate statistical methods for their data.
What file formats can I export from GraphPad Prism?
GraphPad Prism 11 allows you to export graphs and results in commonly used formats such as PDF, PNG, TIFF, JPEG, and EPS, depending on your requirements.
Can Prism software calculate IC50 and EC50?
Yes. GraphPad Prism can be used for dose-response curve analysis and estimation of parameters such as IC50 and EC50 when the appropriate nonlinear regression model is applied to the experimental data.
Is GraphPad Prism better than Excel for scientific data analysis?
Excel is a general-purpose spreadsheet application, while GraphPad Prism is specifically for scientific data analysis and graphing. Prism provides dedicated statistical workflows, scientific graphing tools, nonlinear regression, curve fitting, and research-focused data organization, making it particularly useful for experimental and life-science research, making it far better than Excel.
Does GraphStats provide GraphPad Prism training?
Yes, GraphStats Academy offers live online GraphPad Prism training created to help researchers and professionals use Prism effectively. Training can cover data organization, graph creation, statistical analysis, regression, and other practical Prism workflows.
Where can I learn more about GraphPad Prism?
GraphStats Academy, a division of GraphStats Technologies, offers live, instructor-led online training in GraphPad Prism and Biostatistics, focused on practical, hands-on learning. If you prefer self-learning, explore our GraphPad Prism resources, tutorials, and guides to enhance your data analysis and graphing skills.
What GraphPad Prism license should I choose?
The appropriate license depends on whether you are an individual researcher, student, academic institution, laboratory, or commercial organization. Explore our Organize Your Data Effectively guide or contact GraphStats for assistance based on your intended use.
Why should I purchase through an India-based partner?
Buying locally offers a smoother purchasing experience with domestic payments, GST-compliant documentation, and local support, without the complexities of overseas transactions.
Do I receive the same OEM product?
Yes. You receive the genuine OEM product with the same features, licensing, and product support.
Can I make payment in Indian Rupees (INR)?
Yes. Domestic payment options are available, making the purchasing process simpler for Indian customers.
Will I receive a GST-compliant invoice?
Yes. We provide GST-compliant documentation to support your organization's finance and procurement requirements.
Is local support available after purchase?
Yes, customers benefit from local assistance and support, making it easier to resolve product or licensing queries.
Does purchasing locally avoid overseas vendor processes?
Yes. Purchasing through an India-based partner simplifies procurement by avoiding many of the complexities associated with foreign vendors, international payments, and overseas documentation.
Ready to Get Started?
Join thousands of researchers who rely on GraphPad Prism every day.