Correlation and Linear Regression
The direction and strength of the association between two numeric variables, X and Y, is measured by correlation, which is always between −1.0 and 1.0. A value of +1 indicates a perfect positive relationship, −1 indicates a perfect negative relationship, and 0 indicates no linear relationship.
Whereas a simple linear regression connects X and Y through an equation:
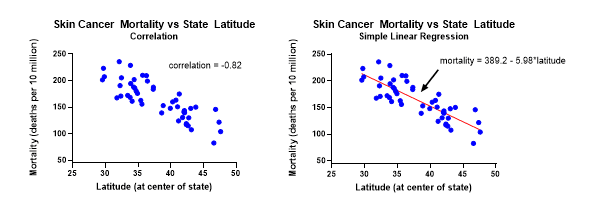
Relationship between Correlation and Linear Regression
- Both provide information about direction and strength of the relationship between two numeric variables.
- The regression slope (b) will be negative if the correlation (r) is negative.
- The regression slope will be positive if the correlation is positive.
- In simple linear regression, the correlation squared (r2 or R2) has a unique meaning. It denotes the percentage of variation in Y that can be explained by X.
Differences between Correlation and Linear Regression
- The idea of regression is to figure out how X influences Y, and the outcomes of the study will alter if X and Y are switched. The X and Y variables are interchangeable in correlation.
- Regression is based on assumption that X is fixed and error free, such as a temperature setting or dose amount. While in correlation, X and Y both are usually random variables*, such as heart rate and blood pressure or weight and height.
- The difference between correlation and regression is that correlation produces a single statistic, whereas regression produces a whole equation.
*Correlation can be used to fix the X variable, but confidence intervals and statistical tests are no longer useful. When X is fixed, regression is normally used.
Advantage of correlation
Correlation summarises the relationship between two variables in a more compact (single value) manner than regression. As a result, several pairwise correlations can be seen in one table at the same time.
Advantage of regression
A more extensive analysis is provided by regression, which includes an equation that can be utilized for prediction and/or optimization.
Correlation with an Example
Let's have a look at the correlation matrix, which has an automobile dataset with variables such as Cost in USD, MPG, Horsepower, and Weight in Pounds. Rather than merely looking at the correlation between one X and one Y, we can use Prism's correlation matrix to generate all pairwise correlations.
- Launch GraphPad Prism and from left side panel select Multiple Variables.
- Select Start with sample data to follow a tutorial and select Correlation matrix.
- Select Create.
- Select Analyze.
- Select Multiple variable analyses > Correlation matrix.
- Click OK button twice.
- On the left side panel, double click on the graph titled Pearson r: Correlation of Data 1.
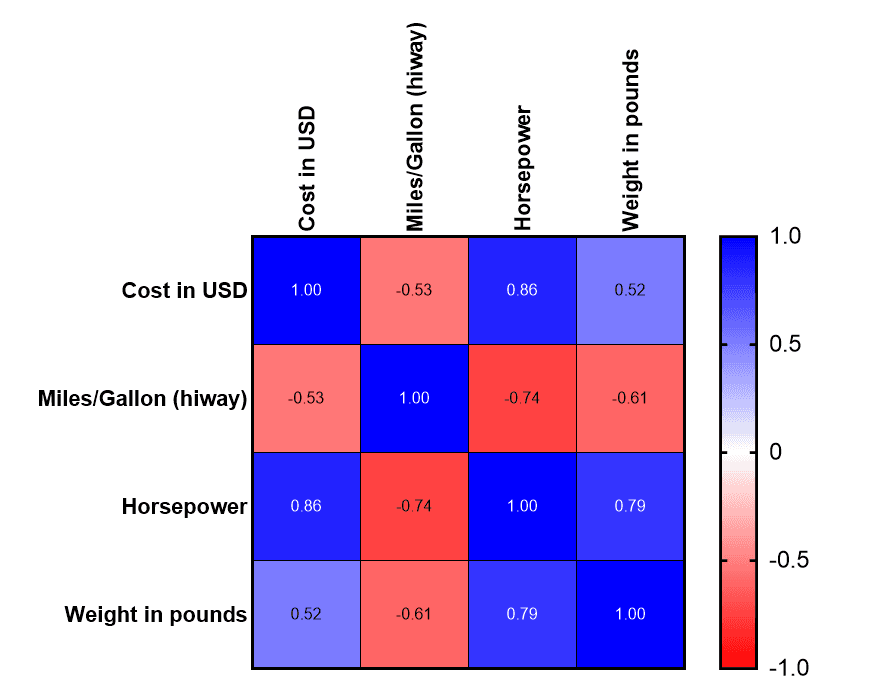
The Prism correlation matrix displays all the pairwise correlations for this set of variables.
- Variables with a negative relationship are represented by the red boxes.
- Variables with a positive relationship are represented by blue boxes.
- The closer the connection is to a negative or positive 1, the darker the box.
- The dark blue diagonal boxes can be ignored, as their correlation will always be 1.00.
Key findings:
- Horsepower and MPG have a strong negative relationship (r = −0.74), which means that higher horsepower cars will have less MPG.
- Horsepower and cost are highly positive relationship (r = 0.88), with higher horsepower cars costing more.
- It's worth noting that the matrices are symmetric. For example, the lower left corner's correlation between "weight in pounds" and "cost in USD" (0.52) is the same as the upper right corner's correlation between "cost in USD" and "weight in pounds" (0.52). This further proves that X and Y are interchangeable in terms of correlation.
When interpreting correlations, you should be aware of the four possible explanations for a strong correlation:
You should be aware of the four probable explanations for a strong correlation when interpreting correlations:
- The value of the Y variable changes as the X variable changes.
- The value of the X variable changes as the Y variable changes.
- Both X and Y are affected by changes in another variable.
- X and Y aren't supposed to be related at all, and you just happened to see a big association by chance. The probability of this happening is quantified by the P value.
Regression with an Example
The strength of UV rays varies by latitude. The higher the latitude, the less exposure to the sun, which corresponds to a lower skin cancer risk. So where you live can have an impact on your skin cancer risk. Two variables, cancer mortality rate and latitude, were entered into Prism's XY table. The Prism graph (right) shows the relationship between skin cancer mortality rate (Y) and latitude at the center of a state (X). It makes sense to compute the correlation between these variables, but taking it a step further, let's perform a regression analysis and get a predictive equation.
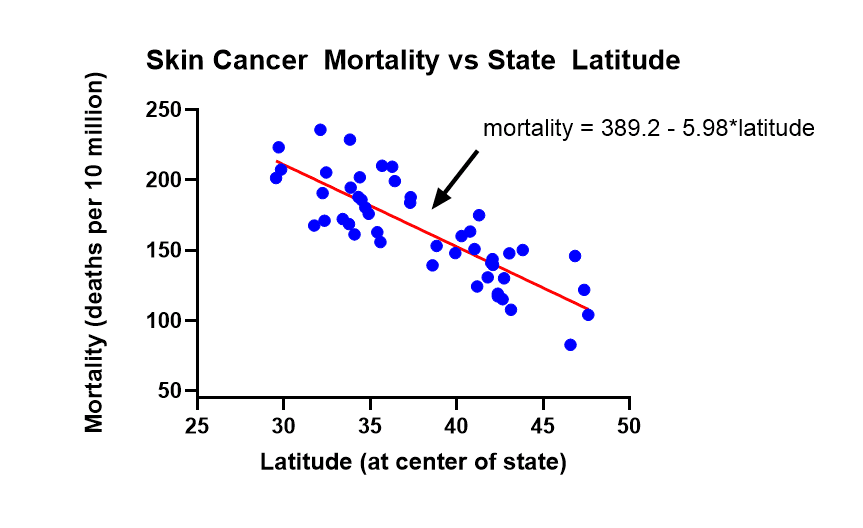
The relationship between X and Y is summarized by the fitted regression line on the graph with equation: mortality rate = 389.2 – 5.98 × latitude. Based on the slope of −5.98, each 1 degree increase in latitude decreases deaths due to skin cancer by approximately 6 per 10 million people.
Since regression analysis produces an equation, unlike correlation, it can be used for prediction. For example, a city at latitude 40 would be expected to have 389.2 – 5.98 × 40 = 150 deaths per 10 million due to skin cancer each year. Regression also allows for the interpretation of the model coefficients:
- Slope: every one degree increase in latitude decreases mortality by 5.98 deaths per 10 million.
- Intercept: at 0 degrees latitude (Equator), the model predicts 389.2 deaths per 10 million. Although, since there are no data at the intercept, this prediction relies heavily on the relationship maintaining its linear form to 0.
Improve your linear regression with Prism. Get started by clicking the link Prism 9 Download
Correlation and Linear Regression Summary
In summary, correlation and regression have many similarities and some important differences. Regression is primarily used to build models/equations to predict a key response, Y, from a set of predictor (X) variables. Correlation is primarily used to quickly and concisely summarize the direction and strength of the relationships between a set of 2 or more numeric variables.
The table below summarizes the key similarities and differences between correlation and regression.
| Topic | Correlation | Regression |
|---|---|---|
| When to use | For a quick and simple summary of the direction and strength of pairwise relationships between two or more numeric variables. | To predict, optimize, or explain a numeric response Y from X, a numeric variable thought to influence Y. |
| Quantifies direction of relationship | Yes | Yes |
| Quantifies strength of relationship | Yes | Yes |
| X and Y interchangeable | Yes | No |
| Y Random | Yes | Yes |
| X Random | Yes | No |
| Prediction and Optimization | No | Yes |
| Equation | No | Yes |
| Extension to curvilinear fits | No | Yes |
| Cause and effect | No | Attempts to establish |
Test your understanding of Regression and Correlation
Which tool, correlation or regression, would you use in each of these scenarios:
- You have two measuring systems and you want to see how well they agree with each other. So you measure the same 20 parts with each measuring system.
- You want to predict blood pressure for different doses of a drug.
- A clinical trial has multiple endpoints and you want to know which pair of endpoints has the strongest linear relationship.
- You want to know how much the response (Y) changes for every one unit increase in (X).
Answers:
- These two variables are interchangeable responses, so correlation would be most appropriate.
- Regression is the right tool for prediction.
- A correlation matrix would allow you to easily find the strongest linear relationship among all the pairs of variables.
- The slope in a regression analysis will give you this information.