PeakLab™ empowers researchers to derive precise mathematical models from complex experimental datasets
High-precision Gaussian, Lorentzian, and Voigt peak fitting with advanced predictive analytics.
PeakLab provides industry-leading spectroscopy and chromatography analysis, featuring true Voigt deconvolution, sophisticated Instrument Response Function (IRF) modeling, and powerful chemometric predictive modeling capabilities.

Industry-leading spectroscopy and chromatography analysis
PeakLab provides industry-leading spectroscopy and chromatography analysis, featuring true Voigt deconvolution, sophisticated Instrument Response Function (IRF) modeling, and powerful chemometric predictive modeling capabilities.
Advanced Spectroscopic Peak Fitting
PeakLab delivers industry-leading peak fitting capabilities for UV-Vis, FTIR, NIR, Raman, XPS, fluorescence, and gamma-ray spectroscopy. With support for Gaussian, Lorentzian, Voigt, and asymmetric peak shapes, users can accurately model complex spectra, separate overlapping components, and extract meaningful quantitative information from challenging datasets.
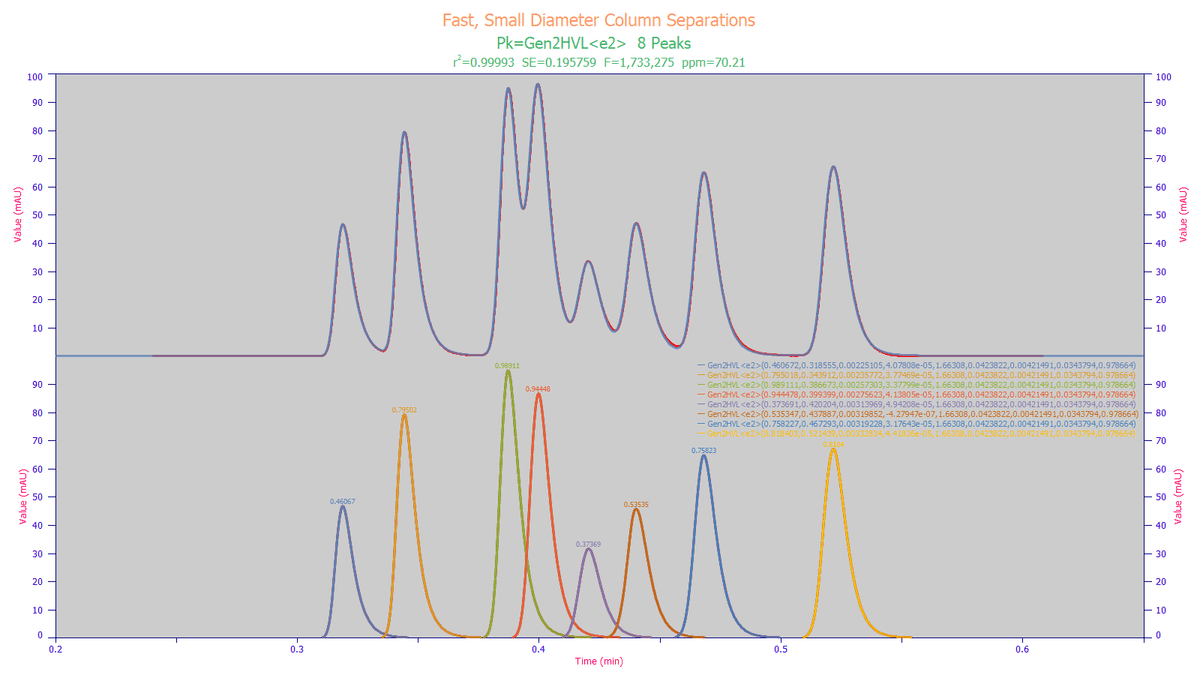
Chromatographic Peak Fitting & System Suitability
Designed for high-accuracy chromatographic analysis, PeakLab models both well-resolved and heavily overlapping peaks. Its advanced chromatography algorithms distinguish column performance from instrument effects, making it an ideal solution for system suitability testing, method development, quality control, and regulatory applications.
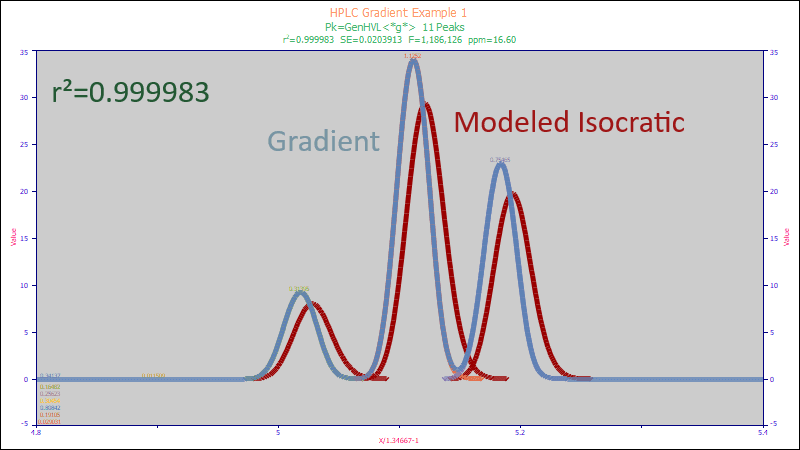
UHPLC & Preparative Chromatography Modeling
PeakLab provides specialized models for UHPLC, gradient HPLC, and preparative chromatography applications. Researchers can accurately characterize peak asymmetry, co-elution, gradient effects, and complex separations, enabling deeper insights into chromatographic performance and sample composition.
%20Estimation.png&w=1200&q=75)
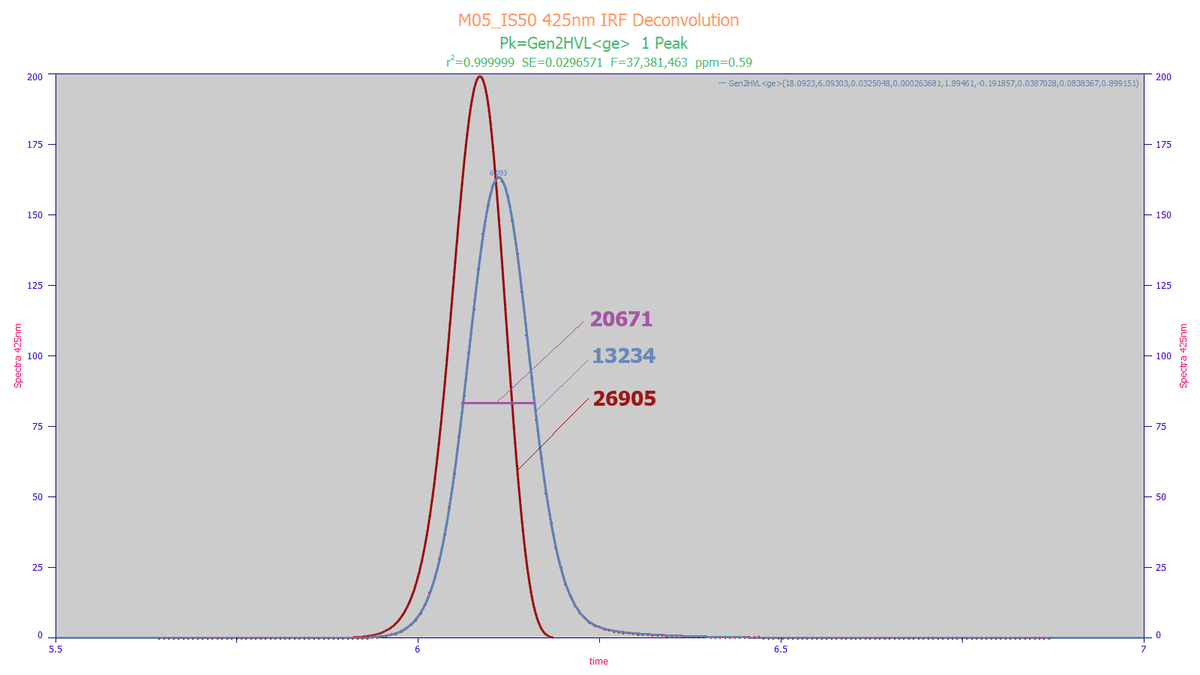
Fourier Deconvolution & Instrument Response Function (IRF) Estimation
PeakLab incorporates advanced Fourier deconvolution techniques to remove instrumental distortions from measured data. By estimating and modeling Instrument Response Functions (IRFs), the software can recover underlying peak shapes and improve the accuracy of spectroscopy and chromatography analyses.
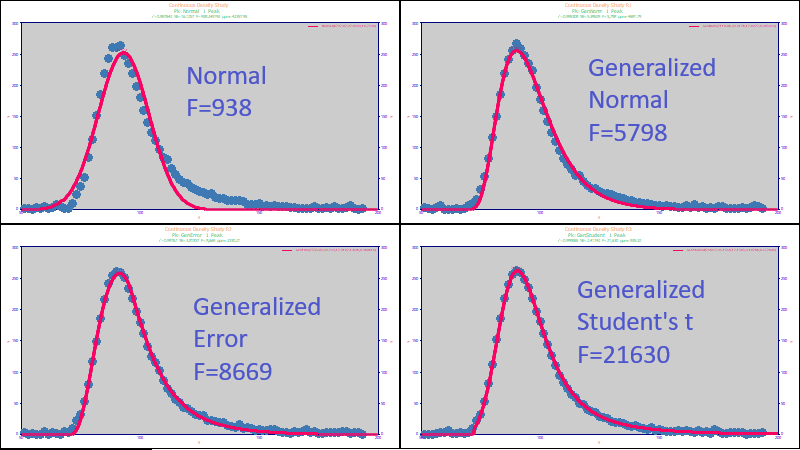
Statistical Probability Density Modeling
PeakLab supports nearly 100 continuous probability density functions for advanced statistical analysis. Users can perform histogram fitting, distribution analysis, kernel density estimation, and probability modeling to better understand data behavior and variability.
Digital Signal Processing (DSP)
PeakLab includes a comprehensive suite of signal processing tools to improve data quality and analytical performance. Features include smoothing, noise reduction, interpolation, Fourier filtering, spectral enhancement, and signal-to-noise evaluation, helping users prepare data for precise modeling and interpretation.
Multi-Dataset Processing
The software enables simultaneous visualization, fitting, comparison, and preprocessing of multiple datasets within a unified workspace. This capability streamlines large projects and allows users to efficiently manage batch analyses and comparative studies.
Publication-Quality Visualization & Reporting
PeakLab produces professional-quality graphs, peak overlays, residual plots, statistical summaries, confidence intervals, and reporting outputs. These publication-ready visualizations help researchers communicate findings clearly in scientific journals, technical reports, and presentations.
Explore the Powerful Features of PeakLab
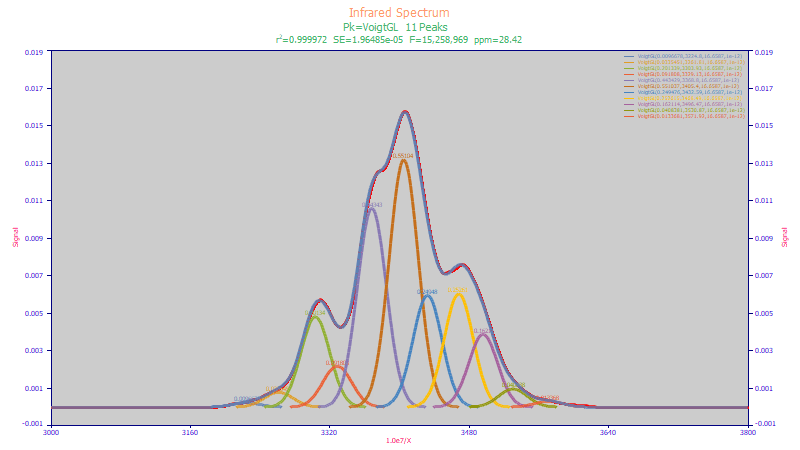
Gaussian, Lorentzian, and Pure Voigt Peak Fitting for UV/VIS, IR/FTIR, NIR/FTNIR Spectra
PeakLab combines advanced mathematics, powerful visualization, and high-speed processing to deliver a complete solution for spectroscopy and chromatography peak analysis. PeakLab offers advanced peak fitting capabilities with Gaussian, Lorentzian, and true Voigt models specifically designed for UV/Vis, IR/FTIR, and NIR/FT-NIR spectral analysis. The software includes 46 built-in spectroscopy functions, featuring a full-precision analytical Voigt function for highly accurate peak characterization.
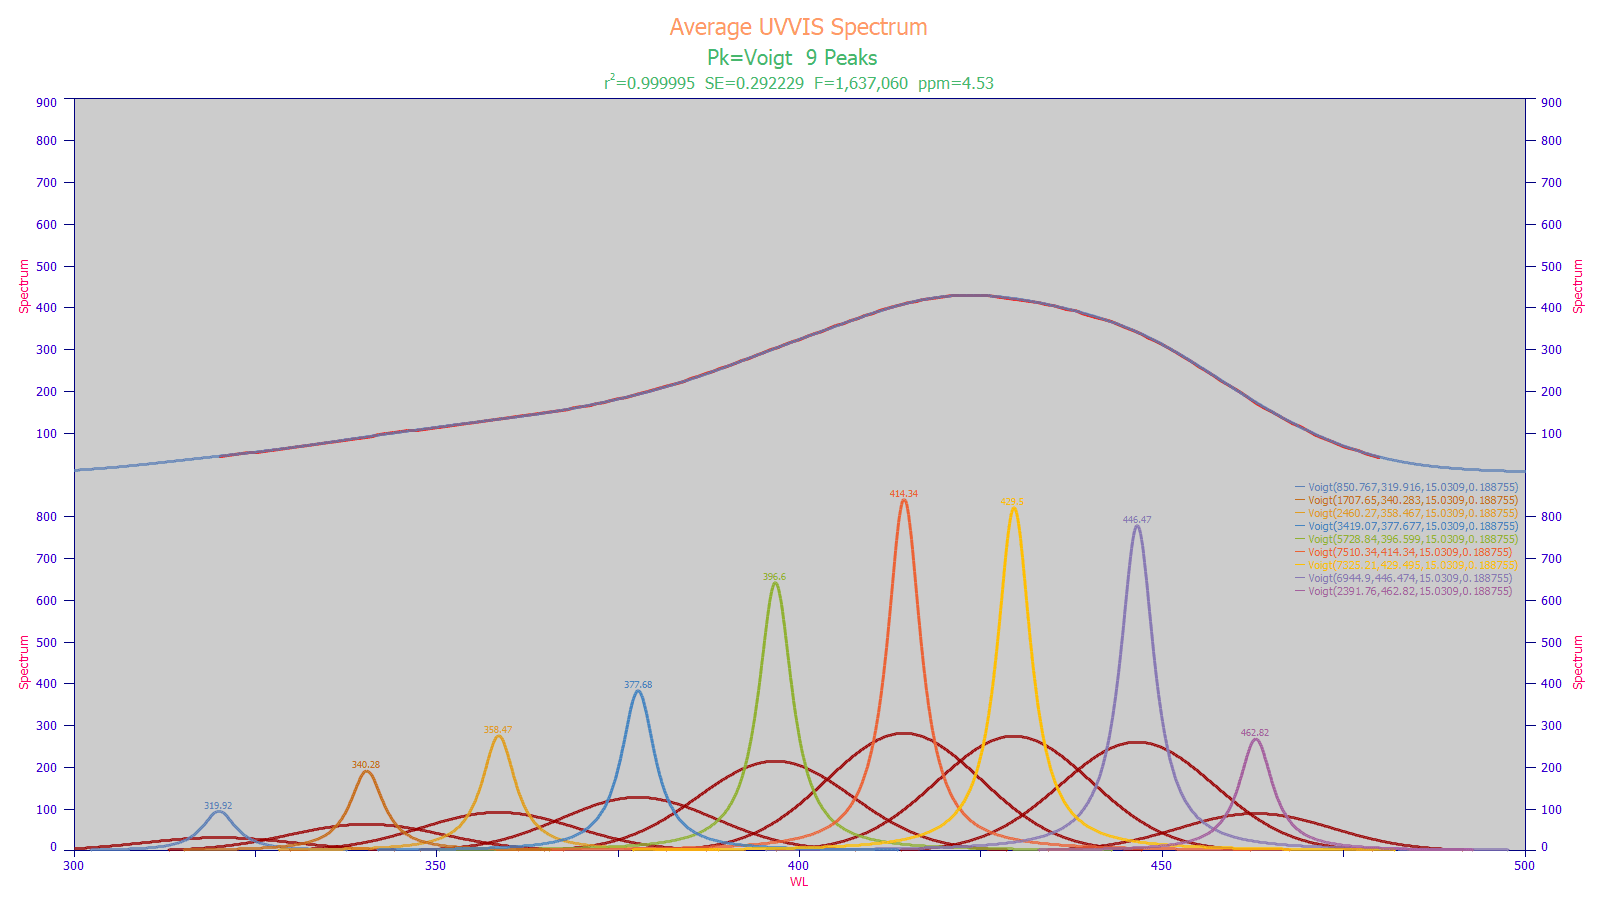
True Voigt Deconvolution
One of PeakLab's most powerful capabilities is its full-precision analytical Voigt function. Unlike approximations used in many software packages, PeakLab performs true Voigt deconvolution, allowing users to automatically separate Gaussian and Lorentzian broadening effects and obtain highly accurate peak parameters for advanced spectral interpretation.
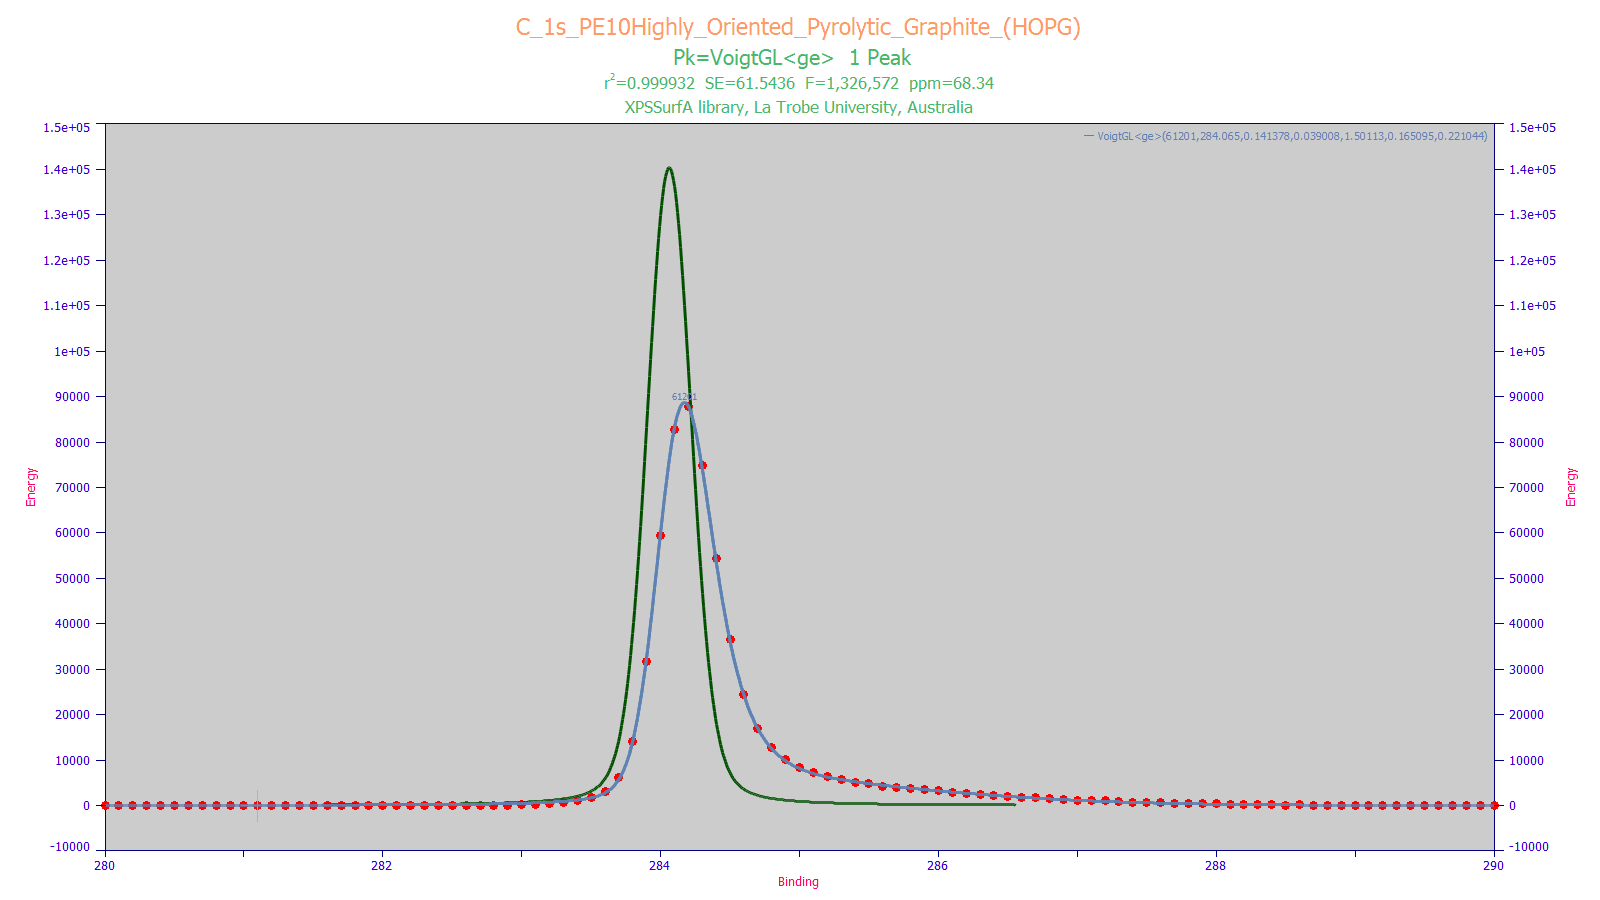
Voigt Models with IRFs for Asymmetric XPS and Raman Peaks
PeakLab provides advanced Voigt Models with Instrument Response Functions (IRFs) specifically developed for X-ray Photoelectron Spectroscopy (XPS) and Raman spectroscopy. By combining true Voigt line shapes with instrument-specific response functions, it delivers exceptional precision in spectroscopy peak fitting, enabling researchers to distinguish overlapping peaks, quantify chemical species, and extract meaningful analytical information.
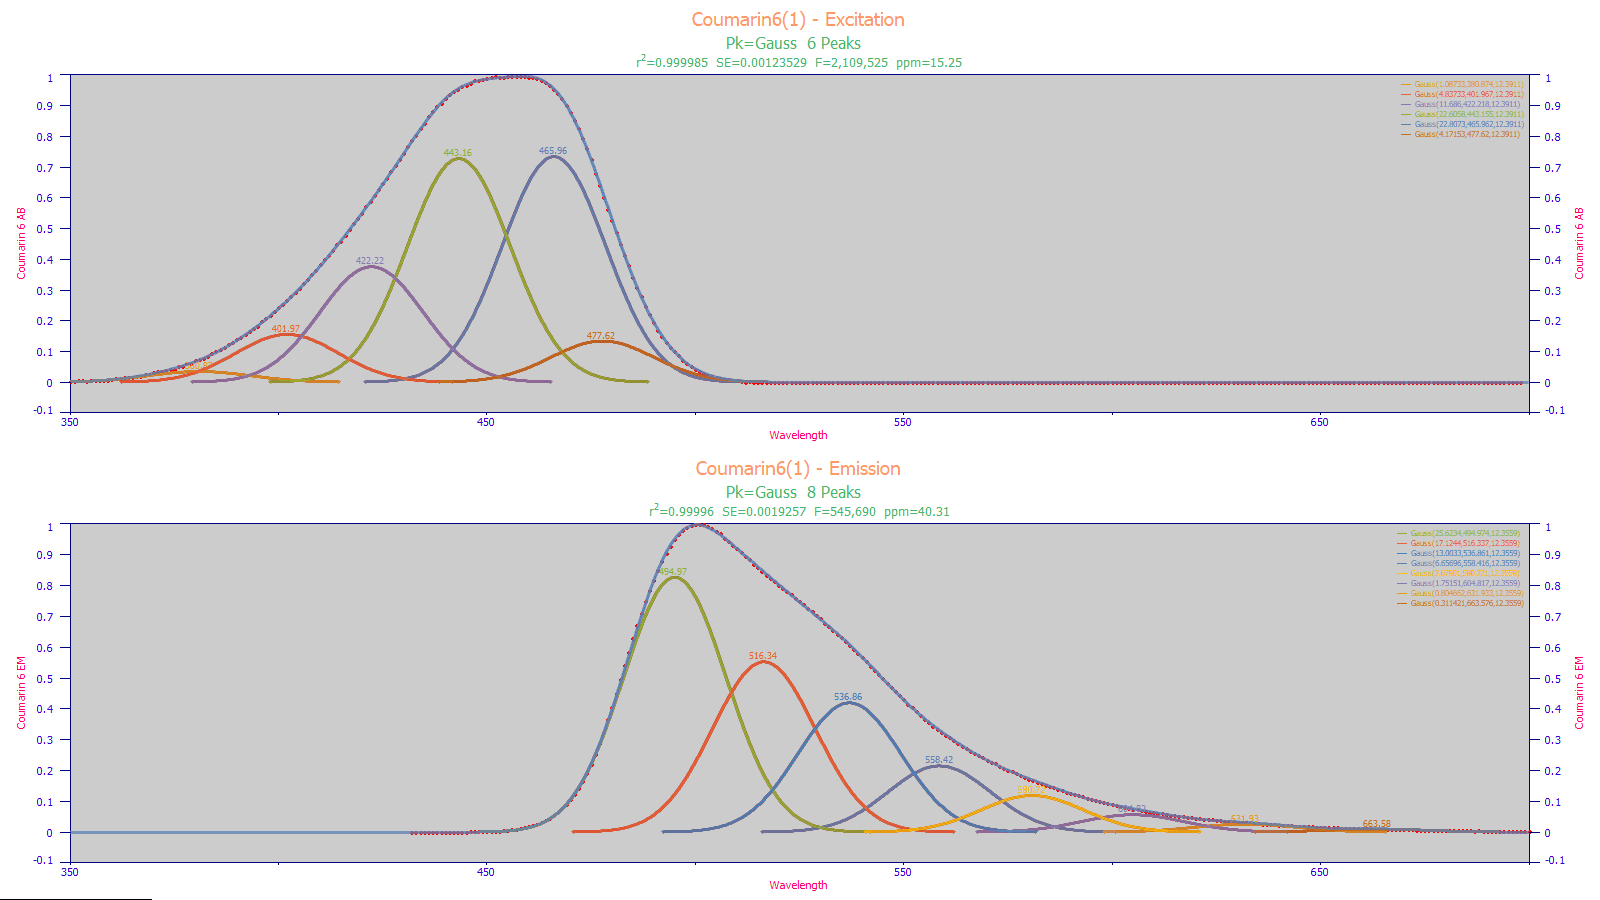
Fluorescence Excitation and Emission Spectrum Analysis
A multiple Gaussian peak fitting approach effectively identifies the principal excitation and emission wavelengths, providing reliable quantitative results without unnecessary model complexity. Designed for advanced spectroscopy data analysis, it enables researchers to resolve overlapping fluorescence signals, improve peak identification, and generate precise, publication-quality results.
Applications of PeakLab
Rx Pharmaceutical & Biotech
Supports FTIR/Raman polymorph identification, HPLC peak purity analysis, dissolution profile modeling, and accurate impurity quantitation from GC/MS data for pharmaceutical research and quality control.
Spectroscopy Labs
Enables FTIR band deconvolution, Raman band assignment and quantification, NIR background correction and band fitting, and UV-Vis multi-component spectral deconvolution for accurate spectroscopic analysis.
Chromatography
Facilitates overlapping HPLC peak deconvolution, GC baseline correction and peak integration, ion chromatography quantitation, and resolution of co-eluting compounds for precise chromatographic analysis.
Process & Petrochemical
Facilitates GC refinery stream deconvolution, in-line Raman process monitoring, and NIR blend component peak fitting for efficient process optimization, quality control, and petrochemical analysis.
Materials Science
Enables XRD peak profile fitting, Raman characterization of nanomaterials, TGA differential peak analysis, and DSC crystallization peak fitting for advanced materials characterization.
Academia & Research
Supports rigorous deconvolution, peak fitting, and quantitative analysis of spectroscopic and chromatographic data across diverse scientific disciplines, enabling high-quality research and publication-ready results.
Spectroscopy & Chromatography Applications
Ready to experience PeakLab?
Start a 15-day free trial or request a custom quote for your lab, institution, or organisation.
FAQ's
What peak functions are available in PeakLab?
PeakLab includes more than 45 built-in peak functions, including Gaussian, Lorentzian, Voigt, Pseudo-Voigt, Pearson, chromatographic, and spectroscopy-specific models for accurate peak characterization.
What is the difference between Voigt and Pseudo-Voigt fitting in PeakLab?
PeakLab offers a full-precision analytical Voigt function that accurately models both Gaussian and Lorentzian broadening effects, whereas Pseudo-Voigt functions are mathematical approximations that trade some accuracy for computational speed.
How does PeakLab detect hidden peaks?
PeakLab automatically identifies hidden peaks using residual analysis, second-derivative methods, and Fourier deconvolution techniques to reveal components that may not be visible in raw data.
Can PeakLab fit heavily overlapping peaks?
Yes. PeakLab is specifically designed to resolve highly convoluted and overlapping peaks in spectroscopy and chromatography datasets using advanced nonlinear optimization algorithms.
Does PeakLab support Instrument Response Function (IRF) modeling?
Yes. PeakLab can estimate and model Instrument Response Functions (IRFs) to compensate for instrument-induced distortions and improve the accuracy of peak measurements.
What baseline correction methods are available?
PeakLab provides advanced baseline subtraction tools, including automated and user-defined baseline models, for handling curved, drifting, and complex baselines.
Can PeakLab perform Fourier deconvolution?
Yes. PeakLab includes Fourier deconvolution technology that can separate instrument effects from sample responses, improving peak resolution and analytical accuracy.
How many peaks can PeakLab fit simultaneously?
PeakLab's Massively Parallel Peak Fitting (MPPF) technology can handle complex datasets containing large numbers of peaks while maintaining computational efficiency and fitting accuracy.
Does PeakLab support batch processing?
Yes. Users can process multiple datasets, apply fitting models, perform baseline corrections, and generate results across large data collections through automated workflows.
Can users create custom fitting models?
Yes. PeakLab allows users to define custom equations and mathematical models, providing flexibility for specialized scientific applications.
What optimization algorithms does PeakLab use?
PeakLab combines advanced nonlinear least-squares optimization methods with genetic algorithms to solve challenging fitting and predictive modeling problems.
Can PeakLab quantify peak areas and peak heights?
Yes. PeakLab automatically calculates peak areas, heights, widths, centroids, and other key parameters required for quantitative analysis.
Does PeakLab provide confidence intervals and statistical metrics?
Yes. The software reports goodness-of-fit statistics, confidence intervals, residual analysis, and parameter uncertainties to help validate analytical results.
Can PeakLab analyze both spectroscopy and chromatography data?
Yes. PeakLab supports a wide range of spectroscopic and chromatographic techniques within a single integrated platform.
What file formats can be imported into PeakLab?
PeakLab supports standard ASCII and text-based data formats, enabling easy import of data generated from most scientific instruments and software platforms.
Can PeakLab generate publication-quality figures?
Yes. PeakLab produces high-resolution graphs, fitted peak overlays, residual plots, and customizable visualizations suitable for publications and presentations.
Does PeakLab support predictive modeling?
Yes. PeakLab includes a predictive modeling framework capable of building calibration models from spectroscopy, chromatography, and other multivariate datasets.
Can predictive models be exported for deployment?
Yes. PeakLab can automatically generate C++ and Visual Basic source code, allowing predictive models to be deployed directly into external software and industrial systems.
How does PeakLab improve chromatographic analysis?
PeakLab uses specialized chromatographic peak models to accurately characterize peak asymmetry, co-elution, gradient effects, column performance, and system suitability parameters.
Is PeakLab suitable for high-precision scientific research?
Yes. PeakLab is designed for researchers and analytical scientists who require advanced peak fitting, deconvolution, predictive modeling, and publication-quality results with the highest possible accuracy.
Ready to Get Started with PeakLab?
Join researchers worldwide who rely on PeakLab for advanced peak fitting, deconvolution, and chemometric modeling. Contact us for pricing or a personalized demonstration.